DataProfile: Notebook-Normalized Portfolio Telemetry Engine in Go
Portfolio telemetry and statistical visualization engine built in Go 1.23+ (standard library only, zero external dependencies) for data scie...
Organization / Context: Projeto Autônomo / Open Source
Timeline: 2026 - Present
Domain Category: Data Engineering
Technologies: Go 1.23+, GitHub GraphQL v4, GitHub REST v3, Chrome DevTools Protocol (CDP), Kaggle API v1, Hugging Face Hub API, SVG / SMIL, GitHub Actions
Executive Overview
Portfolio telemetry and statistical visualization engine built in Go 1.23+ (standard library only, zero external dependencies) for data scientists, machine learning engineers, and quantitative researchers. Strips embedded base64 chart images and cell output payloads from Jupyter Notebooks (.ipynb) before byte counting, scans dependency manifests across the data stack, and aggregates metrics from GitHub, Kaggle, and Hugging Face Hub into 36 parameterized SVG panels across the visualization schools of Edward Tufte, Stephen Few, Alberto Cairo, and Nigel Holmes.
Summary Panels Across the Four Visualization Schools
The engine renders each analytical dimension and the consolidated overview (summary.svg) across four classic statistical visualization grammars:
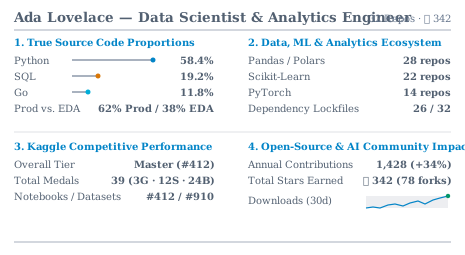
High data-ink ratio grammar with zero outer cages, dot-dash plot for normalized code share, supertables, and inline sparkline with interquartile band.
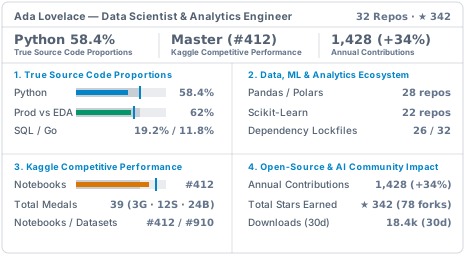
Three-second scanning dashboard with top KPI strip, bullet graphs featuring qualitative bands, and vertical target threshold markers.
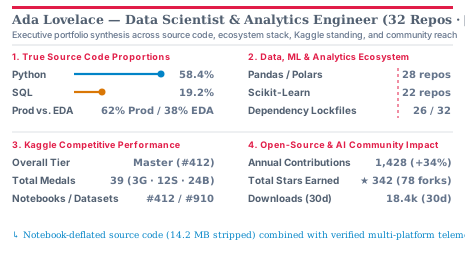
Data-journalism editorial layout with crimson top rule, lollipop charts with dashed benchmark lines, and contextual annotation layer (↳).
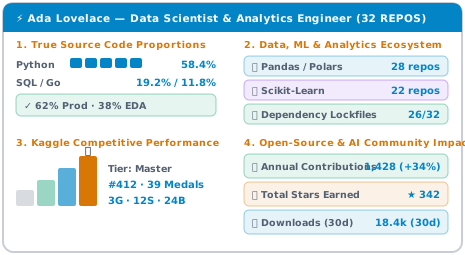
Pictorial ISOTYPE grammar with header ribbon, 10% unit blocks for code share, stepped Kaggle progression podium, and visual ecosystem badges.
Architecture & Data Flow
The diagram below illustrates the sanitized high-level component topology and data processing pipeline:
flowchart TD
  A[Manifesto profile.yaml + Overrides .env] --> B[Carregador & Normalizador Go 1.23+]
  B --> C1[Coletor GitHub GraphQL v4 & REST v3]
  B --> C2[Coletor Híbrido Kaggle CDP + API v1]
  B --> C3[Coletor Hugging Face Hub REST]
  C1 --> D[Desinflador AST JSON de Notebooks .ipynb]
  C1 --> E[Scanner de Stack pyproject.toml / DESCRIPTION / SQL]
  D --> F[Agregador de Domínio PortfolioData]
  E --> F
  C2 --> F
  C3 --> F
  F --> G[Motor Paramétrico SVG Dual-Surface]
  G --> H1[Escola Tufte]
  G --> H2[Escola Few]
  G --> H3[Escola Cairo]
  G --> H4[Escola Holmes]
Key Engineering Highlights
- Notebook Deflation (.ipynb): Strips embedded base64 chart payloads and JSON cell output metadata before counting source bytes to separate exploratory notebooks (EDA) from production modules.
- Concurrent Multi-Source Collection: Parallel ingestion across GitHub GraphQL v4/REST v3, Kaggle (headless Chrome CDP paired with REST API v1), and Hugging Face Hub.
- Dual-Surface Parameterized SVG Engine: Deterministic rendering of 9 panels across 4 visualization schools (Tufte, Few, Cairo, and Holmes), with native text reflow, SMIL animations, and WCAG AA contrast on light (#ffffff) and dark (#0d1117) themes.